
Telegraf and influxdb seem to be the new craze in the time-series database world, add in Grafana and you have the basis for a very powerful graphing solution. I personally have moved all my machines away from using Collectd and Graphite to using Telegraf and influxdb
This is a quick rundown on how to install Telegraf, influxdb and Grafana on a CentOS 7 machine. I am assuming you already have CentOS 7 installed and updated.
Prerequisites
There isnt really any additional software you need to install before starting the influx install. Just make sure you have wget installed.
Installing InfluxDB
Lets get on with the installation.
The links to influxdb will be the latests ones available. I would suggest double checking on the InfluxDB website to make sure you are getting the latest version. As i am writing this, the latest version is v1.2.0.
Lets grab the RPM:
1
wget https://dl.influxdata.com/influxdb/releases/influxdb-1.2.0.x86_64.rpm
This should only take a minute as its a pretty small package.
Once thats complete, lets install the RPM:
1
sudo yum localinstall influxdb-1.2.0.x86_64.rpm
This should only take a minute or so to complete.
We might as well start influxdb and also get it to start on boot.
1
2
3
systemctl start influxdb
systemctl enable influxdb
While we are dealing with Influx, we should also create the Telegraf database.
To do that, type influx into the terminal, this will take you to the InfluxDB Shell. Then type CREATE DATABASE telegraf which will create a database called telegraf. Then type exit to get back to your linux shell.
If you look at the status of the influxdb service with systemctl status influxdb you should see the POST which created the database.
We do also need to open up 2 ports in firewalld. Run the following commands to allow the 2 ports through and then reload the firewall.
1
2
3
firewall-cmd --permanent --add-port=8086/tcp
firewall-cmd --permanent --add-port=8083/tcp
firewall-cmd --reload
Note: As this is not exposed to internets, i have not password protected the DB. That would be advisable though.
Now thats all completed, we are ready to install Telegraf.
Installing Telegraf
As with the influxdb installation, im using the latest available version of Telegraf which is currently v1.2.0.
First we need to grab the RPM:
1
wget https://dl.influxdata.com/telegraf/releases/telegraf-1.2.0.x86_64.rpm
Again, should only take a minute or so.
Then we need to install it:
1
sudo yum localinstall telegraf-1.2.0.x86_64.rpm
Once again, that will only take a minute.
Now that the installation is complete, we need to make a couple of changes to the Telegraf config. The file we need to edit is /etc/telegraf/telegraf.conf.
As this is running on the same machine as InfluxDB, we just need to check the database is set to telegraf. That is all we need to change in the outputs section. We do also need to make a little change to inputs section (if you want, that is), by defualt telegraf doesnt gather network stats, so you need to add [[inputs.net]] just underneath [[inputs.system]].
Once you have made those changes, you can start the service and set it to start on boot.
1
2
systemctl start telegraf
systemctl enable telegraf
That is it for the Telegraf install. Now onto Grafana.
Installing Grafana
Just like the previous installs, ill be using the latest version of Grafana. Luckily though, Grafana provide a repository, instead of having to install RPM’s manually. So lets add the repo to our machine.
Using you favourite text editor, open up the following file (it doesnt currently exist):
1
/etc/yum.repos.d/grafana.repo
Then paste in the following:
1
2
3
4
5
6
7
8
9
[grafana]
name=grafana
baseurl=https://packagecloud.io/grafana/stable/el/6/$basearch
repo_gpgcheck=1
enabled=1
gpgcheck=1
gpgkey=https://packagecloud.io/gpg.key https://grafanarel.s3.amazonaws.com/RPM-GPG-KEY-grafana
sslverify=1
sslcacert=/etc/pki/tls/certs/ca-bundle.crt
Then, all you need to do is:
1
yum install grafana
Once that is done, we need to start Grafana and also set it to start on boot.
1
2
systemctl start grafana-server
systemctl enable grafana-server
We now just need to open up the Grafana UI port, which is 3000/tcp.
1
2
firewall-cmd --permanent --add-port=3000/tcp
firewall-cmd --reload
Try loading up the interface through your browser on port 3000, you should be greeted with the Grafana login screen.
The default login is Username: admin, Password: admin.
Once you are in, you now need to add Influx as the datasource. On the homepage, it should say Add Datasource, click that, then fill it out like in the following image:
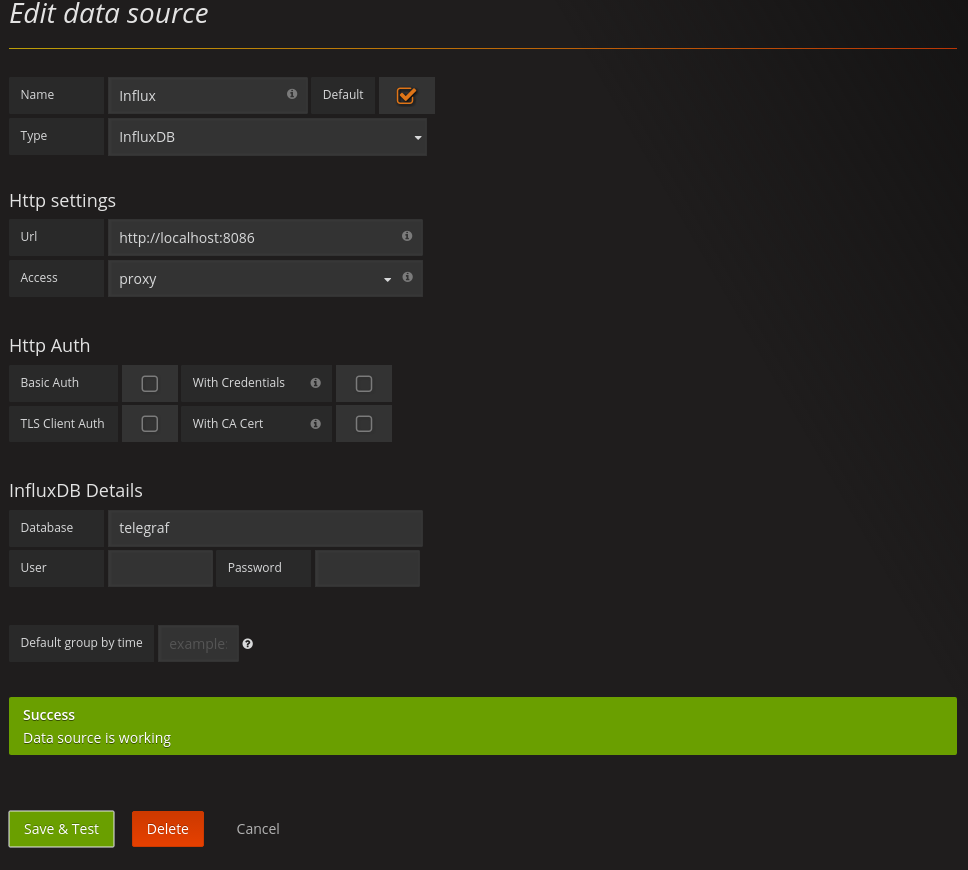
Once that is completed, you are ready to start creating dashboards.
Any problems, add a comment and ill help you out.